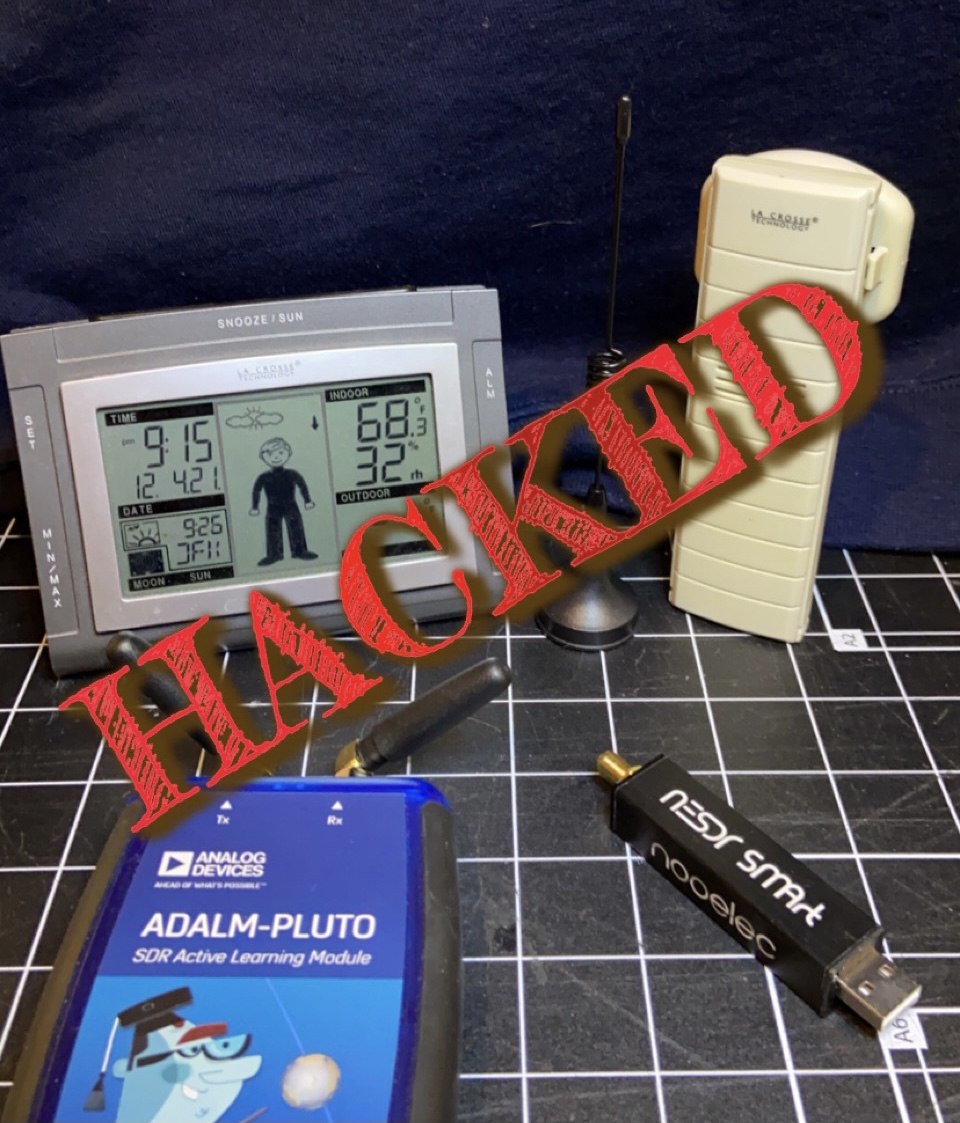
For about the same cost as of case of PBR, you can buy a cheap software defined radio called the RTL-SDR. With this simple USB dongle, you can turn your PC into a wideband radio scanner and use it to sniff out RF signals anywhere from 25 MHz to 1700 MHz.
In case you’re not familiar, an SDR receiver works a lot like a traditional radio transceiver, except that most, if not all, of the signal processing that would normally happen in hardware, is done with software instead. Essentially, an SDR receiver captures the raw radio signals (using a tuner), shifts them down from RF to baseband using a mixer, digitizes the analog signals with an ADC and streams the data to a PC or embedded device. The PC sucks in the raw baseband waveforms and does all of the processing that’s traditionally done in hardware like demodulation, timing synchronization, carrier synchronization, channel coding, etc. An SDR transmitter works the same, but in reverse.
The flexibility of software signal processing, coupled with the ability to operate over a vast RF frequency range make SDRs a great tool for sniffing and spoofing wireless signals. In this post, I’ll show how I used two different ones and some open source software to reverse engineer the protocol of a simple wireless weather station.
I initially started drilling down into all of the related DSP and digital communications fundamentals directly in this post, but then realized it would be best to leave that to the professionals. If you’re a noob like me, I highly recommend checking out PySDR. It’s a great hands-on introduction to SDR, DSP, and wireless communications in general. If your still thirsty for more, take a look at Analog Device’s Software Defined Radio for Engineer’s, it’s more comprehensive and won’t cost you a dime!
What’s in the Tool bag?
RTL-SDR
A couple years ago, I picked up this cheapo RTL-SDR from Nooelec. The RTL-SDR is a very common and inexpensive receive-only SDR that was originally designed to receive digital television broadcasts (DVB-T) over USB. It comes in different form factors from various manufacturers, but the guts of all of them are all based on the same chips: the RTL2832U and R820T (PDF). It can deliver an instantaneous bandwidth of up to approximately 2.5 MHz, has 8-bit resolution, and a tuning range of 24 MHz to 1766 MHz. If you manage to make it through this post without your eyes glazing over completely, then chances are good that you either already have one of these or need to just go get one and start hacking! There’s tons of projects and tutorials out there for it. I eventually bought this model, mainly because it had a more standard SMA antenna connector.
ADALM-PLUTO
For $20, the RTL-SDR is definitely an impressive device. But if you want to transmit, you’ll need to pony up a bit more cash. A neat perk of my day job is a yearly allowance to spend on anything learning related. So last year I burned $150 of it on a ADALM-PLUTO, Analog Devices’ education level SDR. I also considered the LimeSDR Mini and HackRF One, but ultimately the Pluto seemed best suited for beginners who are interested in learning the fundamentals of digital communications. Apparently the LimeSDR can run a full blown LTE femtocell, which is no doubt badass, but way too far over my head for me to have any clue of what’s actually going on.
The Pluto has a lot of interesting features, some of which are immediately useful to me and others I hope to take advantage of down the road:
- One transmitter and one receiver, half or full duplex. Each has its own SMA antenna connector.
- Off-the-shelf RF coverage from 325 MHz to 3.8 GHz, which can be expanded with a few terminal commands to 70 MHz to 6 GHz (The extended range came in handy when I hacked my 315 MHz garage door opener)
- Up to 20 MHz of instantaneous bandwidth, which can apparently also be increased with terminal commands to over 60 MHz, although it seems unlikely that you could get USB to keep up (haven’t tried that yet).
- 12-bit ADC and DAC (a significant improvement over the 8-bit RTL-SDR)
- Two USB ports, one of which can be used to supply power to the Pluto, or as a USB On-The-Go host to connect an ethernet adapter or USB drive.
- Runs Linux, which opens the door to all sorts of possibilities, including standalone operation
- Integrated Xilinx FPGA that can run custom code
- Plenty of interfacing options and code examples: libiio, a C, C++, C#, and Python API


Universal Radio Hacker
Universal Radio Hacker (URH) is an awesome piece of open source software you can use to “investigate wireless protocols like a boss”. It interfaces natively with the RTL and the Pluto (and others) and is the main software used in this experiment. And although I’ve only scratched the surface of what it can do, I’d be lying if I said I didn’t indeed feel like a boss the moment I saw the bogus temperature data it was generating show up on the weather station! Check out these videos if you want to get started with it.
Hunting for a sitting duck
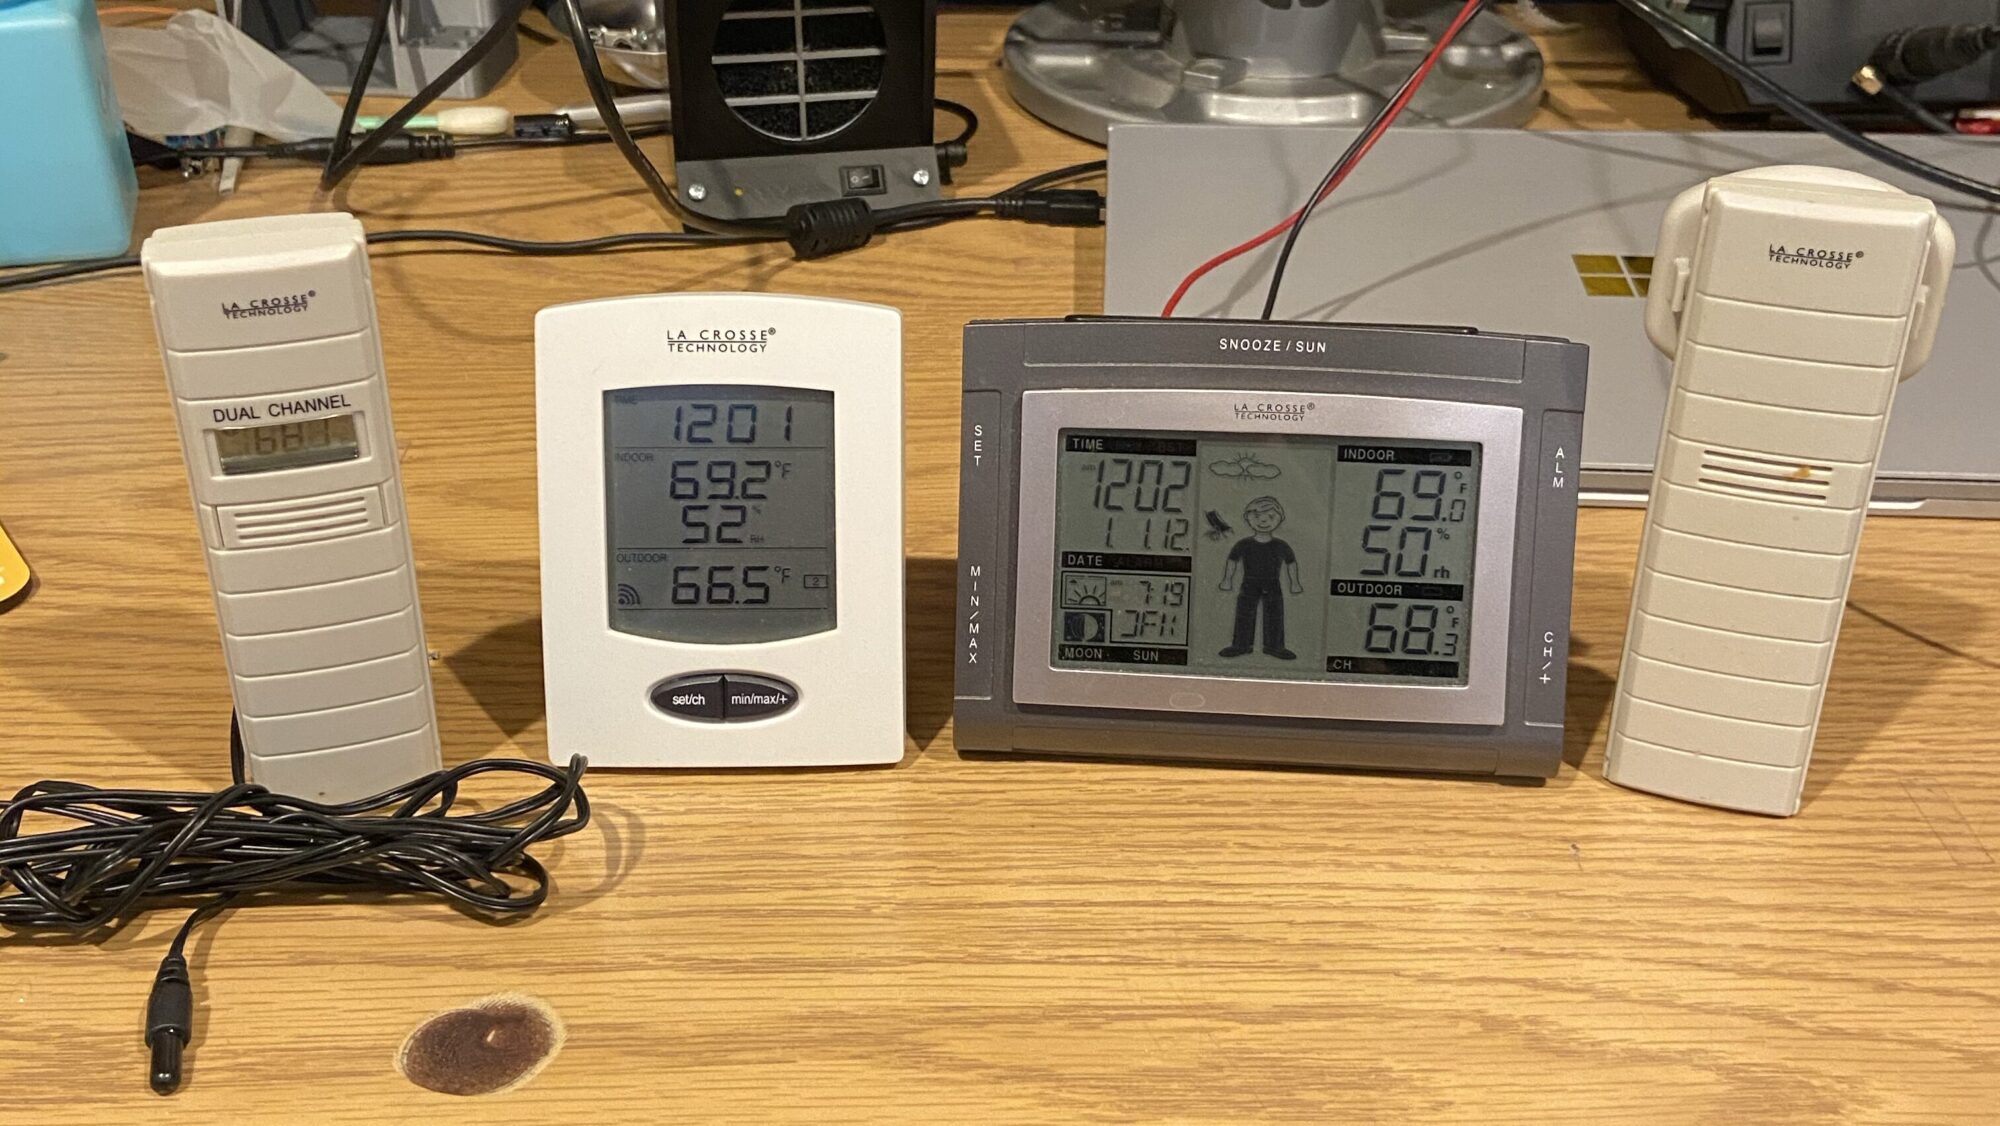
After kicking the tires a bit on the RTL-SDR, I wanted to see if I could sniff out and decode some kind of “real” wireless signal without any a priori knowledge of its protocol. I got this nice La Crosse WS-9611U-IT Wireless Weather Station and TX29U Wireless Temperature Sensor set (the two rightmost devices) from a friend a couple years ago and hoped it might be just dumb enough for me to crack. My hunch was that it used some kind of simple protocol and only communicated in one direction (from sensor to base station). There were a few surprises along the way, but this turned out to be more or less true. I also got my hands on a dual channel sensor and base station (the two devices on the right), which turned out to be over-the-air compatible with the original set.
One quirk with these systems is how the sensor gets paired with the base station. To sync them up, you need to put the batteries into the base station and the sensor at roughly the same time. If the sensor loses power after this step, the base station will lose synchronization with it and needs to be paired again. I didn’t think much of this at first, but it ended up being important when trying to spoof the transmitter.
O Signal, Where Art Thou?
Obviously the first step was finding a signal to decode. Although both SDRs can cover an enormous RF frequency range (70 MHz to 6 GHz for the Pluto), the width of the spectrum it can receive at any given instant is limited by its instantaneous bandwidth, which is essentially set by the sample rate of its ADC. This limits the amount of spectrum that can be observed at any given time to 20 MHz for the Pluto, and 2.5 MHz for the RTL. Blindly searching the entire RF spectrum for an intermittent signal by looking through this relatively narrow keyhole would be like finding a needle in a haystack. Lucky for me, the carrier frequency of 915 MHz was proudly advertised on the case of the TX29U temperature sensor. If the device you’re trying to crack doesn’t display the carrier frequency, you can usually figure it out by looking up the device’s FCC ID.
The Spectrum Analyzer tool in URH shows a live plot of the power received by the SDR versus frequency and includes a peak hold trace (in red). After a few seconds of watching, two prominent peaks popped out: one at 914.933 MHz and one at 915.053 MHz. This is consistent with Frequency Shift Keying (FSK) modulation, where each symbol (0 or 1) shifts the frequency of the carrier by a fixed amount. That puts the carrier frequency at 914.993 MHz (halfway between the two), very close to the expected 915 MHz, and gives a frequency deviation between the two symbols of about 120 kHz. URH has a built-in FSK demodulator that works without having to manually determine these parameters, but they’ll be good to know later on when we want to synthesize our own signals. The blips seemed to occur about every 30 seconds or so, which seemed reasonable for a low power sensor. I eventually determined that the transmissions were actually set to occur at very specific time intervals on the order of 12 seconds – more on that later.

Samples and symbols and bits, oh my!
Both SDRs I have use a direct conversion receiver, which means they work by shifting the RF spectrum at the tuner’s center frequency down so that it’s centered around DC (0 Hz). This baseband signal is what your PC actually receives in the form of a continuous stream of ADC samples.
Again using URH, I recorded a packet and pulled it into the Interpretation tab seen below. URH can automatically detect the noise floor (in red), and modulation parameters like symbol rate (which is equal to the bitrate in this case, since there’s one symbol per bit), samples per symbol, and modulation type (see the left pane). If you squint at the recorded waveform, you can see the signal bouncing back and forth between two different frequencies.
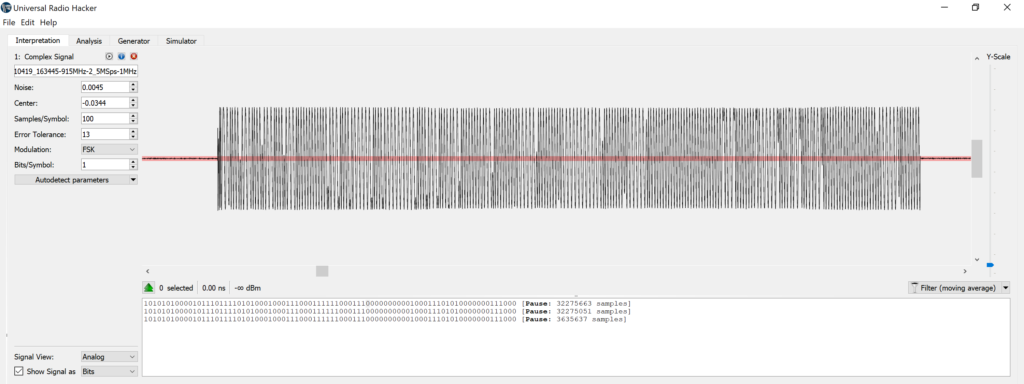
Zooming in, the frequency shift keying is clear. You could probably even decode the bits visually if you split it into symbol (i.e. bit) periods.

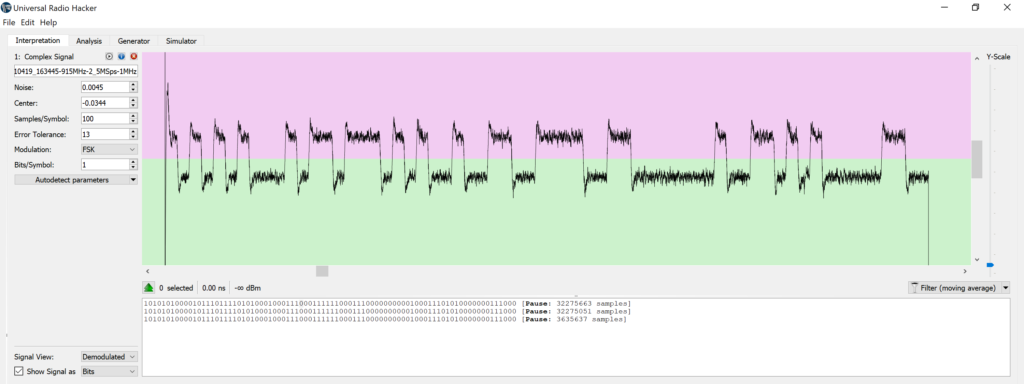
URH spits out a demodulated signal, which for frequency modulation, is the instantaneous frequency shift relative to the tuner’s center frequency, 915 MHz. After demodulation, things start to look a lot more digital. The pink and green boundary sets the threshold for what will become and 1 or 0 and can be dragged up and down for fine tuning. The text box below the demodulated waveform shows the decoded bits.
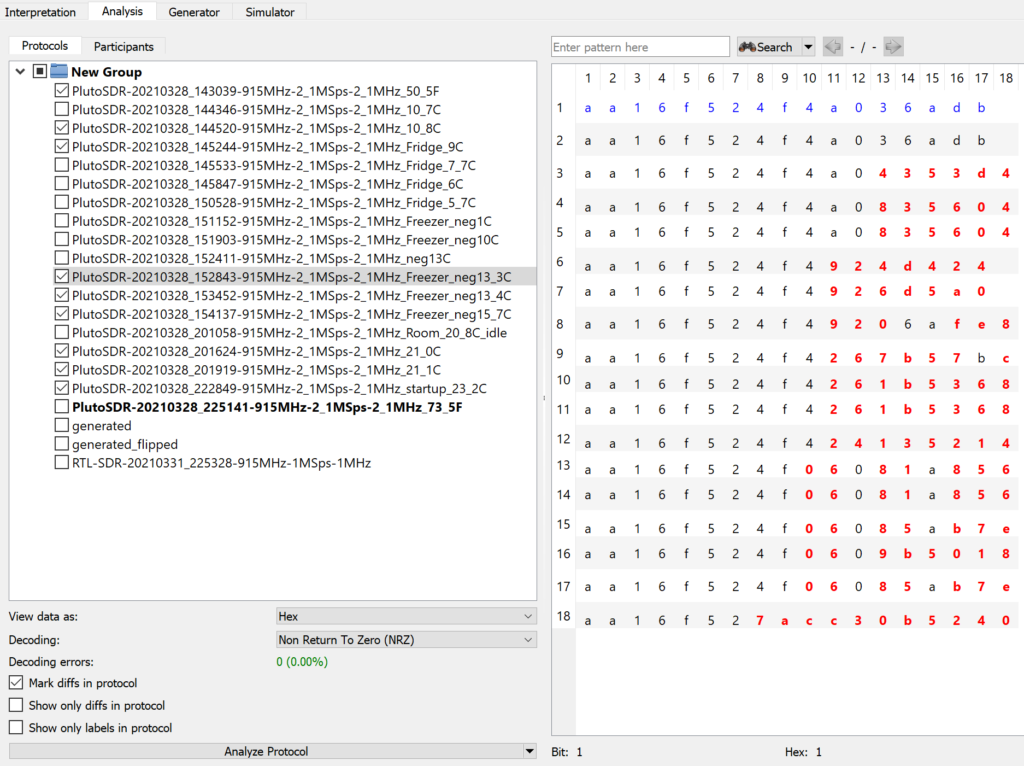
Now that I had some bits, the next step was to figure out where the temperature value was hiding. I collected a bunch of different packets with the sensor at various temperatures and compared them using URH’s Analysis tab (see below). I noticed most of the data was the same for every packet and there were just a handful of bytes that changed with temperature. Another important observation was that identical packets were received repeatedly for a given temperature, suggesting there was no packet sequence numbers to deal with. There were also a handful of bits that seemed to be updated only when the sensor was power cycled. My initial guess was that the sensor generated a random number each time it started up and used it to pair with the base station. Spoiler alert, this wasn’t quite right.
Autodetect fail
If you look closely, you’ll see that some packets have a couple extra bits here and there, suggesting that the sensor was sending different sized packets. That concept didn’t seem unreasonable in general, but varying the packet length by only a bit or two seemed too convoluted and unnecessary – especially for such a dumb sensor. So after banging my head against the wall trying to figure out how to map the changing bytes to a temperature, I’m embarrassed to admit that I cheated a bit and used the google. I found out that a lot of these types of sensors encode the temperature in BCD with a fixed temperature offset (to avoid negative values). So with a 40 degree offset, for example, -6°C would be sent as 0x34 (-6 + 40 = 34). This matched what I was seeing most of the time, but sometimes I’d get bytes with values greater than 9 (not allowed in BCD) for the fields where I thought the temperature was – something wasn’t adding up.
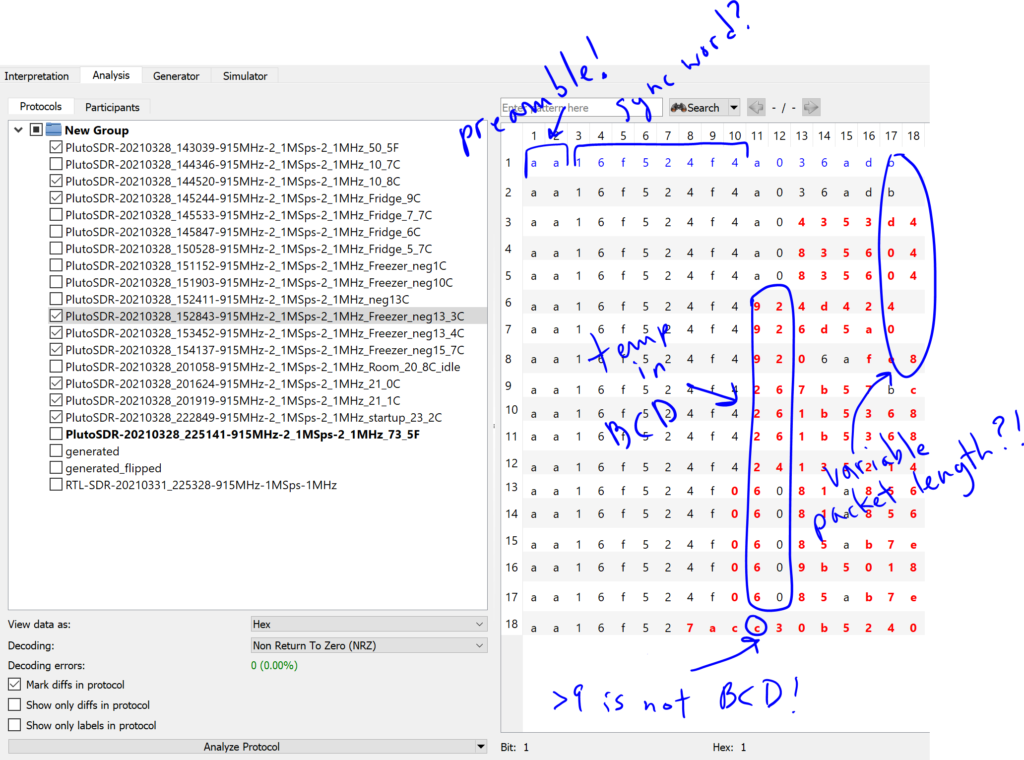
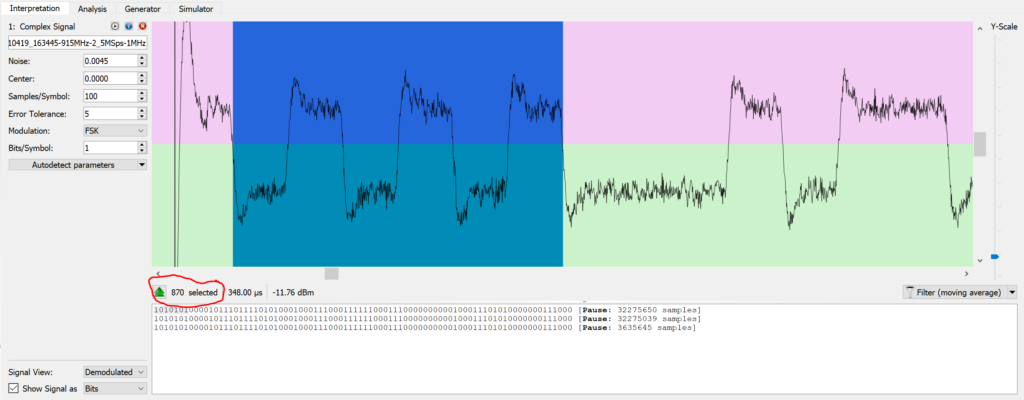
Eventually, I took a closer look at the demodulated waveform and realized that there were more samples per symbol in the signal than URH had autodetected, which meant that it wasn’t looking at the right spot in the demodulated signal when it determined the bit values. Using the demodulated waveform view, I found a spot where I could clearly see where the symbols started and ended. The highlighted span of 6 symbols measured 870 samples, which is 145 samples per symbol. This was quite a bit off from the 100 samples per symbol URH had autodetected and would definitely explain the bit errors. Honestly, I’m amazed that I could decode anything at all with that much error! With a sample rate of 2.5 MS/s, this works out to a data rate of about 17 kilobits per second (one symbol per bit), which seemed reasonable enough.
All I see is blonde, brunette, redhead
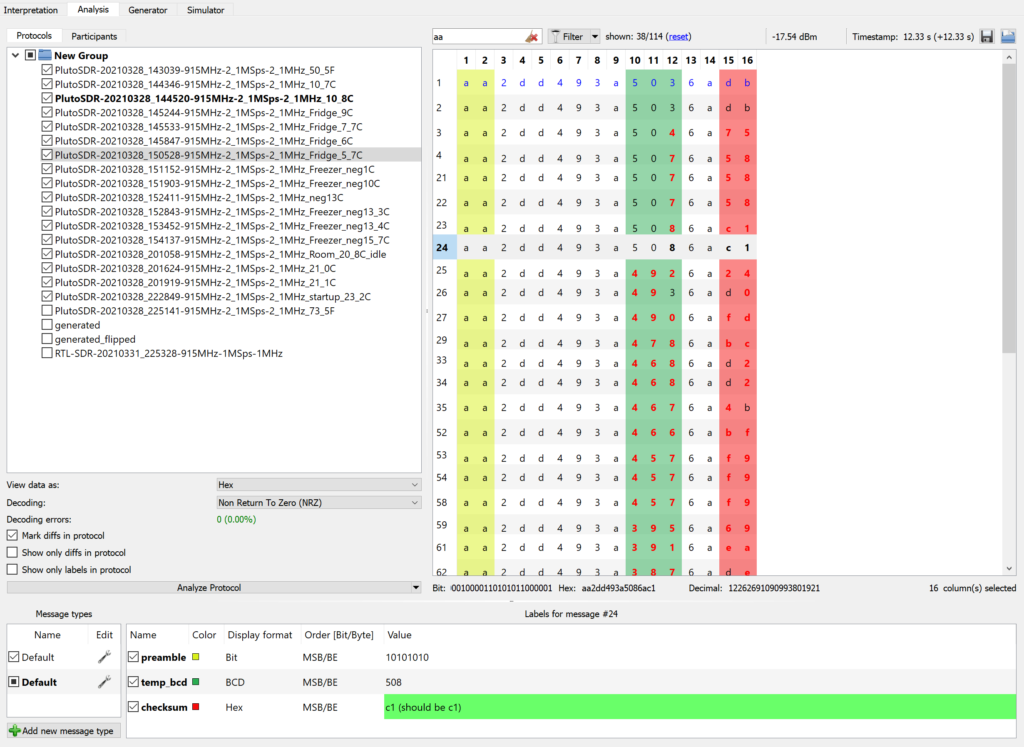
Once the symbol rate was dialed in, things started falling into place! I flipped back over to the Analysis tab to see if I could make sense of the bytes. With the decoded hex values for each packet aligned on a grid, the first thing that jumped out was the consistent preamble of 10101010 (aa in hex). URH highlights the difference between packets in red, which made the temperature field easily identifiable in columns 10 through 12 (each column is one hex digit). And sure enough, it was encoded in Celsius as three BCD digits with a -40°C degree offset! The last byte of each packet (columns 15 and 16) changed reliably anytime a bit was flipped in the packet, so I was pretty sure it was some kind of checksum or CRC.
Cracking the CRC
Although I didn’t need to know how to calculate the CRC value to decode the temperature, I would if I was going to send spoofed data to the base station. There’s no shortage of different CRC algorithms, most of which can be parameterized in some way, so the challenge was to figure out which algorithm was being used, what its parameters were, and what parts of the packet were covered by the CRC.
You can set up URH to automatically verify the CRC for each packet by labeling the fields and setting a couple CRC parameters. I fiddled around with all of the settings, but couldn’t get it to consistently find CRC matches, even though I was pretty sure the decoded data was solid. I tried plugging the data into a bunch of different online calculators to find the correct CRC algorithm, but still no dice. My next thought was to just write a python script to try to brute force all of the possible CRC parameters and test it against the data I had. But then I remembered that there’s no such thing as a new idea and found this Hackaday article on reverse engineering CRCs. Some dude wrote a pretty wicked and super polished little command line tool called CRC RevEng that did exactly what I needed! I fed a couple packets into the magic box and to my surprise it happily spit out a handful of CRC parameters. I plugged those into URH and, bingo, all of the packets had valid CRCs! I’m not sure what motivated La Crosse to use oddball CRC parameters, but I was pretty tickled to see RevEng crack it, so I’m not even mad about it.
Here’s the final settings that worked (look away if you want to figure it out for yourself!):

Cloudy with a chance of pwnage
There’s a little dude on the weather station that supposedly tells you how to dress for the weather and I really wanted to make him dance! Now that I could assemble valid packets with arbitrary data, it was time to attack. But before attempting to generate my own data, I first tried a simple replay attack by recording a few packets and playing them back. To my surprise, it worked! Although it’s not a very useful thing in this particular case, it did confirm a few things about the system. First, that I could faithfully recreate and transmit a received signal with the SDR. And second, that the base station had no problem accepting an identical packet more than once, so I wouldn’t have to worry about synchronizing some kind of packet counter.
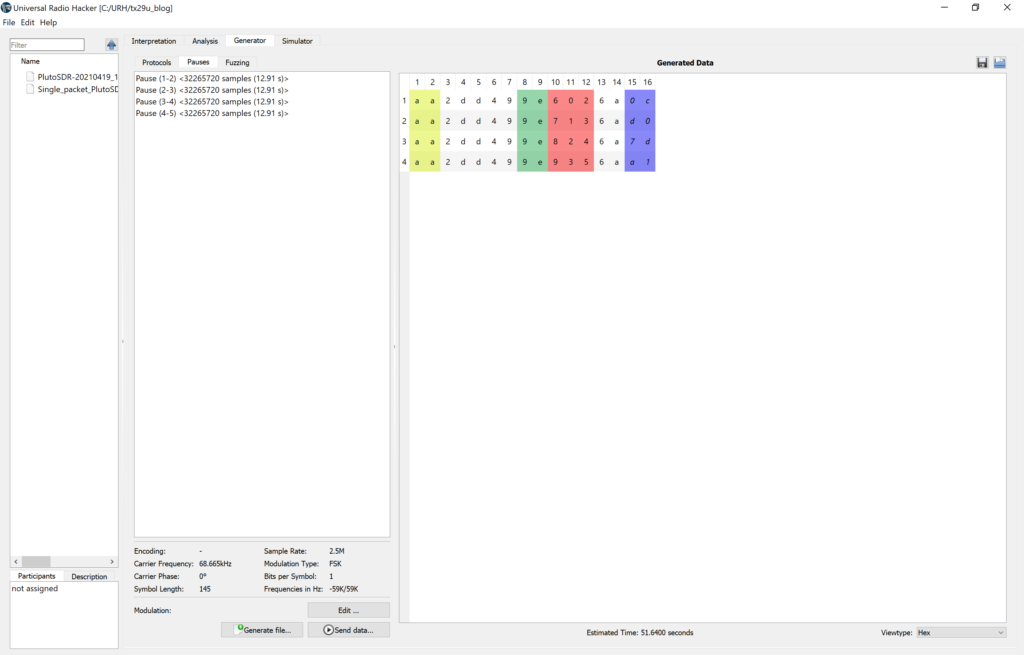
Now it was time to make it rain! Err.. um… high jack the temperature at least. The Generator tab in URH allows you to synthesize and transmit waveforms for whatever data you like. What’s even better is that it will detect the modulation parameters from your recorded waveforms and use them to construct compatible waveforms for the data you want to send. I built the packets below by starting with the data I had captured and decoded, modifying the temperature field (columns 10 – 12) to what I wanted, and letting UHR update the CRC field according the CRC parameters I had entered above:
With the data all set, I popped open the Modulation window, which shows a side by side comparison of the generated signal with the original recorded signal.

After some fiddling around with the Pluto’s sample rate, it worked! The base station showed whatever temperature I sent it! Though it was glorious, the success was limited. I could only get the base station to display my bogus data if it was the first packet it received after a power cycle. Every packet after that was completely ignored.
I kicked around a couple theories as to what could be going on, but eventually settled on it being some kind of timing issue. I knew that the sensors only transmitted a few times per minute, but I hadn’t given much thought about what the base station was doing and assumed that it was continuously listening. But of course it was also battery operated and eventually it occurred to me that it might also want to conserve energy by only turning its receiver on when it expects to receive a message. So if I wanted to send multiple temperature updates, I would have to know when the base station was actually listening.
To figure out what this transmit interval was, I flipped back to the Interpretation tab in URH and measured the time between transmissions. All of the recorded data I had showed the sensor transmitting about every 13 seconds, give or take a second or two. UHR allows you to insert precise pauses in between generated packets, so I plugged in a few different values in that ballpark. But nothing seemed to change. No matter what transmit interval I picked, I could still only get the first one to work. After a few hours of plugging in values, power cycling, waiting 13 seconds for it to transmit and then another 13 seconds just in case it missed first one, I came to the conclusion that timing was just too tight for the SDR to hit.
Finding the missing piece of the puzzle
But the more I thought about, the more absurd it seemed that a SDR ripping at 2.5 MS/s couldn’t hit the mark within (presumably) a few milliseconds. Then finally it dawned on me! I was assuming the timing interval was fixed for all sensors, but what if it was different for each sensor and the base station was able to keep track of it somehow?
There was a byte in the packet (columns/nibbles 8 – 9) that seemed to change each time the sensor was power cycled. I had initially assumed this was some kind of randomized serial number that the base station could use to pair with the sensor and figured it was only relevant in a multiple sensor scenario. But just take a look at the plot below and you’ll see that its correlation with the transmit interval is far from random.

Putting this all together, my understanding of the system goes like this. When the sensor starts up, it randomly chooses one of the 256 possible transmit intervals and starts transmitting packets (which include a byte that indicates the selected transmit interval) at that interval. When the base station starts up, it listens continuously until it receives the first packet with the timing information. From that point on, it only listens at the prescribed interval. Aside from the battery savings, this seems like a simple but effective way to have multiple sensors transmitting in close proximity without trampling all over each other.
Here’s the hack in action at about 15x normal speed. The spoofed temperature is displayed on the bottom right corner in °C.
After some further observation, I noticed that the sensor will actually change the transmit interval without a power cycle. What makes it change it’s mind is anyone’s guess. I also suspect that the base station will eventually fall back into its search mode if it hasn’t heard from the sensor for a while and attempt to resync, but haven’t had the patience to test this.
Multi channel sensors
Now that I had things working with a single channel sensor, I wanted to know how the multiple channel sensors worked. After sniffing the dual channel sensor for a couple minutes, I realized that a 2-channel sensor looks just like two 1-channel sensors: it sends a separate packet with a unique transmit interval for each channel. Although it would require less energy to send both values in one packet, sending two separate packets makes a lot of sense for compatibility reasons. A base station doesn’t need to know or care if it’s picking up one 2-channel sensor or two 1-channel sensors. At startup, it just assigns the next available channel on the display to a sensor, each time it sees a packet with a new transmit interval value.
Ok great, but what do you do with it?
Although finishing this blog post has moved at a glacial pace, the hack itself was actually pretty straightforward thanks to all of the built-in capability of URH. Now that I know how to decode the signal with an interactive tool, the next step is to write some code to do the same thing. My ultimate goal is to use an RTL-SDR plugged into a Raspberry Pi to continuously listen to all of my sensors and feed the data into Home Assistant. Since URH took care of most of the heavy lifting in this project, this will mean going further down the signal processing rabbit hole with PySDR. Wouldn’t it be easier to just buy some modern BLE or WiFi sensors that are off the shelf compatible, you ask? Well you’re not wrong, Walter, but where’s the fun in that?!
The article was featured on Hackaday and RTL-SDR.com. Both sites did a great write up about this and have a ton of related articles. Check them out!